
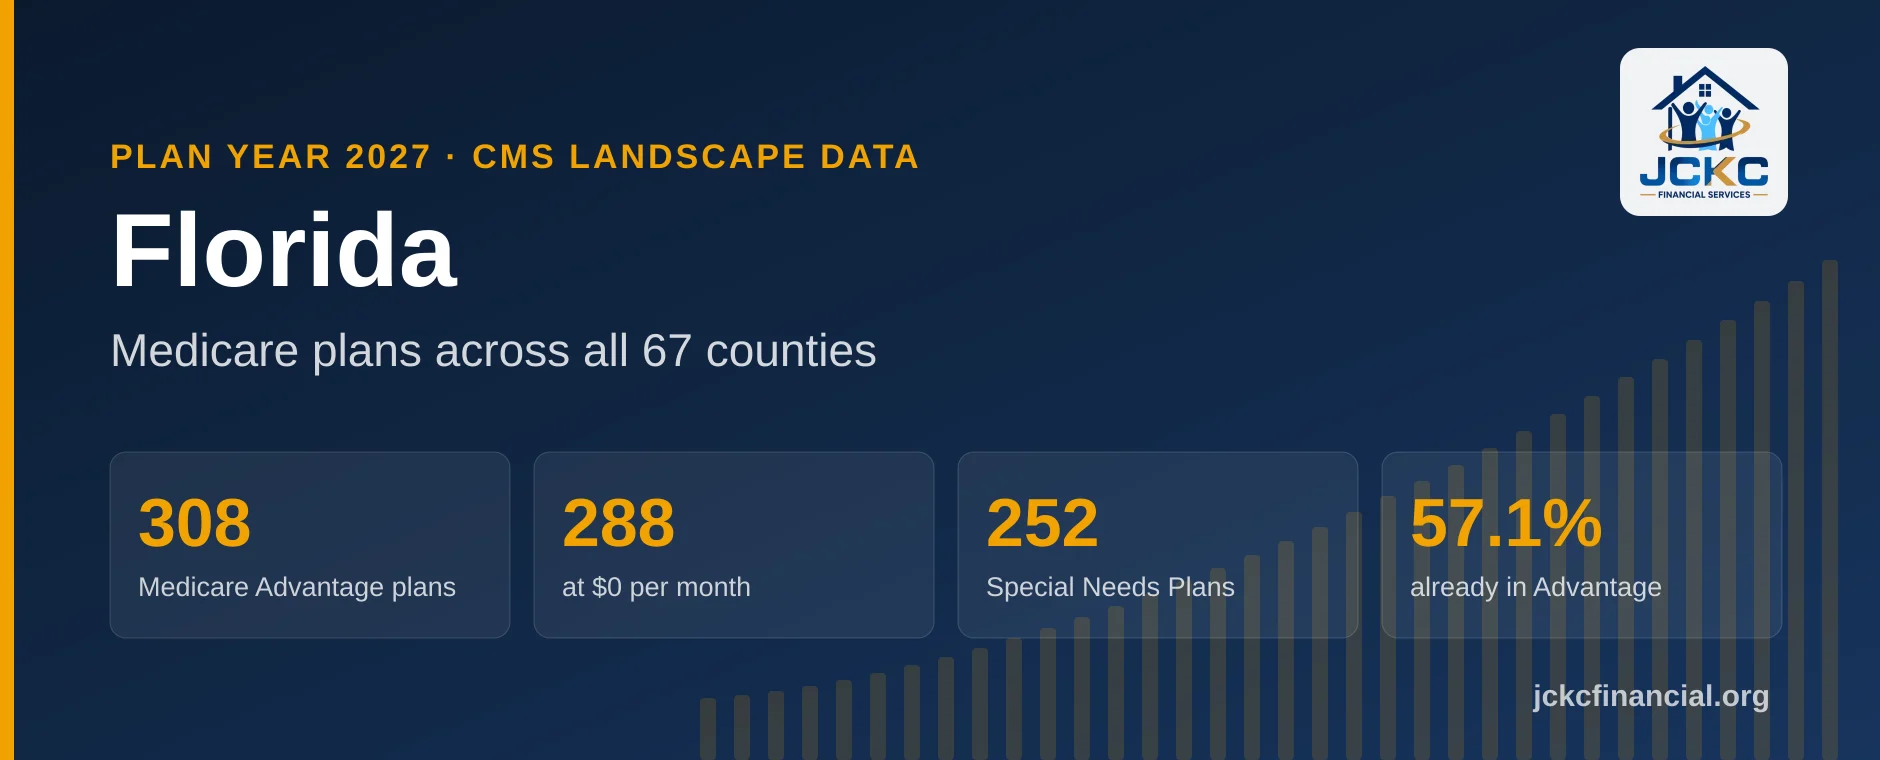
Florida Medicare by the numbers
Every figure here comes from the CMS landscape files for the two plan years, counted the same way on both sides. Medicare Advantage figures exclude Special Needs Plans and stand-alone Part D plans, which are counted on their own rows.
| Measure | 2026 | 2027 | 2027 vs 2026 |
|---|---|---|---|
| Medicare Advantage plans (excludes SNPs and PDPs) | 325 | 308 | −17 |
| Plans with a $0 monthly premium | 294 | 288 | −6 |
| Average Part C premium | $1.04 | $1.75 | +$0.71 |
| Average consolidated Part C + D premium (MA-PD plans only) | $5.08 | $5.08 | no change |
| Average monthly premium actually charged (all plans) | $4.98 | $4.91 | −$0.07 |
| Average in-network maximum out-of-pocket | $4,571 | $4,798 | +$227 |
| Highest in-network maximum out-of-pocket | $9,250 | $9,850 | +$600 |
| Average annual Part D deductible | $343.16 | $480.48 | +$137.32 |
| Special Needs Plans (counted separately) | 286 | 252 | −34 |
| Stand-alone Part D plans (counted separately) | 10 | 11 | +1 |
What changes across Florida for 2027
Comparing the 2026 and 2027 CMS landscape files for Florida plan by plan, here is what moved statewide:
- 17 fewer Medicare Advantage plans — 325 in 2026, 308 for 2027. 49 of the 2026 plans are gone from the 2027 file and 32 are new. Counting Special Needs Plans as well, 124 plans left the Florida shelf and 73 arrived.
- $0-premium plans — 294 in 2026, 288 for 2027. Average out-of-pocket maximum is now $4,798, with the highest on the Florida shelf at $9,850.
- Special Needs Plans went from 286 to 252, and stand-alone Part D from 10 to 11. Florida is a single Part D region, so every county here sees the same stand-alone drug plans.
Humana: 10 plans gone, and 148 county slots with them
Humana is the carrier to check first this year, and its plan count hides what happened. Across Florida it goes from 121 plans in 2026 to 122 for 2027, which looks flat. Count instead the county slots it sells into — one per county per plan — and the picture changes: 1,384 in 2026, 1,236 for 2027, a net loss of 148. The 10 withdrawn plans alone accounted for 265 of those slots, while the 11 new ones add back 150. What it pulled are its Giveback PPOs, among the most widely sold plans in the state.
| Plan leaving | Contract-Plan-Segment | Counties it was sold in |
|---|---|---|
| Humana USAA Honor Giveback (PPO) | H5216-467-0 | 64 |
| Humana Full Access Giveback H5216-393 (PPO) | H5216-393-0 | 56 |
| Humana Full Access Giveback H7617-111 (PPO) | H7617-111-0 | 55 |
| Humana Direct Choice Giveback (PPO) | H5216-452-0 | 20 |
| Humana Direct Choice Giveback (PPO) | H7617-112-0 | 20 |
| HumanaChoice Florida H5216-304 (PPO) | H5216-304-0 | 17 |
| HumanaChoice Florida H7617-109 (PPO) | H7617-109-0 | 17 |
| HumanaChoice Florida SNP-DE H7617-113 (PPO D-SNP) | H7617-113-0 | 9 |
| HumanaChoice Florida H7284-001 (PPO) | H7284-001-0 | 4 |
| CareNeeds Extra (HMO D-SNP) | H1019-152-0 | 3 |
A plan that is absent from the 2027 file is not necessarily terminated — it may have been consolidated into another plan. Until the CMS crosswalk publishes, this page names the plans that are gone and does not say where their members go.
Every carrier with plans leaving or arriving
Carriers with at least one 2026 plan not on the 2027 shelf: Aetna Medicare · Align Senior Care · BayCare Health Plans · CarePlus Health Plans, Inc. · Doctors HealthCare Plans, Inc. · Gold Kidney Health Plan · Health First Health Plans, Inc. · HealthSpring · HealthSun Health Plans, Inc. · Humana · Optimum HealthCare, Inc. · Simply Healthcare Plans, Inc. · Solis Health Plans · Ultimate Health Plans · UnitedHealthcare · Wellcare
Carriers with plans new for 2027: Aetna Medicare · Align Senior Care · AmeriHealth Caritas VIP Care (HMO-D-SNP) · CarePlus Health Plans, Inc. · Devoted Health · Doctors HealthCare Plans, Inc. · Florida Blue · Florida Blue HMO · Gold Kidney Health Plan · Humana · Prominence Health Plan · SECUR Health Plan · Solis Health Plans · Ultimate Health Plans · UnitedHealthcare · Wellcare
Your Annual Notice of Change is the document that matters
If you are already in a Medicare Advantage or Part D plan, your carrier was required to send you an Annual Notice of Change by September 30 for coverage starting January 1. It is not marketing — it is the legal statement of what your own plan is changing. Four lines are worth finding: the monthly premium, the annual drug deductible, the in-network maximum out-of-pocket, and whether your plan is being consolidated into another one. If it says your plan is ending or merging and you do nothing, you will be moved somewhere you did not choose.
For the rules behind all of this, CMS publishes the official handbook each year: Medicare & You 2027 (PDF, medicare.gov).
Where Florida’s Medicare population actually is
Plan counts tell you what is for sale. Enrollment tells you what Floridians actually chose. These are CMS figures for the whole state as of June 2026.
| Group | People | Share |
|---|---|---|
| All Medicare beneficiaries in Florida | 5,334,437 | 100% |
| In a Medicare Advantage or other health plan | 3,046,820 | 57.1% |
| On Original Medicare | 2,287,617 | 42.9% |
| With drug coverage through a Medicare Advantage plan | 2,861,668 | 53.6% |
| With a stand-alone Part D drug plan | 1,556,523 | 29.2% |
| Dual eligible (Medicare and Medicaid) | 916,719 | 17.2% |
| Receiving Part D Extra Help (low-income subsidy) | 1,020,967 | 19.1% |
Florida is close to the national pattern on Medicare Advantage take-up and well above it on sheer size: 5,334,437 beneficiaries, more than any state except California. The number worth sitting with is 1,556,523 — the people on Original Medicare with a stand-alone drug plan. They are the group most exposed to the Part D premium increases further down this page, and they are the least likely to be told about it, because no Medicare Advantage carrier is marketing to them.
All 67 Florida counties compared
Ranked by the number of people on Medicare. Plan counts are the plans available in that county for 2027, so a plan sold statewide appears in every row. The three counties we work in are marked and link to their own full plan tables.
| County | On Medicare | In Advantage | MA plans 2027 | vs 2026 | SNPs | $0 premium | Avg max out-of-pocket |
|---|---|---|---|---|---|---|---|
| Miami-Dade We work here | 524,508 | 75.2% | 41 | −5 | 60 | 35 | $4,555 |
| Broward We work here | 380,230 | 64.8% | 44 | −6 | 62 | 38 | $4,824 |
| Palm Beach We work here | 370,365 | 48.0% | 49 | −6 | 62 | 42 | $5,114 |
| Hillsborough | 275,359 | 62.2% | 52 | −6 | 72 | 47 | $5,224 |
| Pinellas | 263,871 | 60.4% | 50 | −7 | 68 | 45 | $5,352 |
| Orange | 228,284 | 61.4% | 45 | −14 | 61 | 40 | $5,294 |
| Lee | 226,228 | 50.1% | 34 | −7 | 33 | 29 | $6,046 |
| Duval | 196,193 | 53.2% | 42 | −4 | 45 | 35 | $6,171 |
| Polk | 183,548 | 68.5% | 50 | −11 | 60 | 46 | $5,233 |
| Brevard | 183,469 | 50.9% | 45 | +2 | 31 | 38 | $5,788 |
| Volusia | 173,548 | 60.7% | 47 | −1 | 46 | 40 | $5,915 |
| Sarasota | 166,792 | 42.7% | 41 | −2 | 48 | 37 | $5,724 |
| Pasco | 153,526 | 67.1% | 49 | −8 | 71 | 44 | $5,236 |
| Marion | 135,379 | 60.9% | 51 | −4 | 56 | 44 | $5,155 |
| Lake | 127,726 | 57.3% | 48 | −7 | 54 | 42 | $5,088 |
| Manatee | 124,435 | 48.7% | 41 | −5 | 46 | 35 | $5,785 |
| Collier | 123,262 | 37.5% | 32 | −11 | 27 | 26 | $6,166 |
| St. Lucie | 100,546 | 56.6% | 35 | −9 | 46 | 31 | $5,939 |
| Seminole | 91,075 | 54.1% | 46 | −13 | 67 | 40 | $5,376 |
| Sumter | 90,964 | 56.7% | 48 | −4 | 58 | 42 | $5,088 |
| Charlotte | 81,509 | 52.3% | 33 | −8 | 29 | 28 | $6,082 |
| St. Johns | 80,245 | 38.5% | 38 | −6 | 32 | 32 | $6,278 |
| Escambia | 77,314 | 49.9% | 28 | −4 | 23 | 21 | $7,105 |
| Osceola | 76,623 | 71.7% | 45 | −13 | 67 | 40 | $5,346 |
| Citrus | 67,394 | 58.4% | 35 | −4 | 48 | 31 | $5,384 |
| Hernando | 63,590 | 67.9% | 40 | −11 | 53 | 36 | $5,540 |
| Indian River | 63,111 | 42.9% | 43 | −1 | 51 | 37 | $5,534 |
| Alachua | 54,533 | 41.8% | 16 | −8 | 22 | 10 | $6,825 |
| Leon | 53,686 | 60.6% | 13 | −1 | 7 | 7 | $7,162 |
| Martin | 52,903 | 40.7% | 33 | −7 | 40 | 29 | $6,123 |
| Clay | 52,381 | 43.2% | 40 | −5 | 39 | 33 | $6,214 |
| Flagler | 48,709 | 54.2% | 42 | −1 | 31 | 35 | $6,161 |
| Okaloosa | 47,309 | 35.4% | 18 | −2 | 13 | 13 | $7,044 |
| Santa Rosa | 45,116 | 46.0% | 28 | −4 | 23 | 21 | $7,105 |
| Bay | 44,528 | 43.0% | 19 | −4 | 13 | 12 | $7,045 |
| Highlands | 37,430 | 59.5% | 25 | −12 | 22 | 20 | $6,060 |
| Nassau | 30,154 | 42.8% | 33 | −1 | 26 | 26 | $6,505 |
| Putnam | 21,841 | 57.8% | 24 | +3 | 19 | 18 | $6,798 |
| Walton | 20,690 | 42.3% | 21 | −4 | 14 | 15 | $7,019 |
| Monroe | 19,195 | 23.7% | 7 | no change | 1 | 2 | $8,393 |
| Columbia | 18,534 | 51.9% | 16 | −7 | 14 | 10 | $7,019 |
| Levy | 13,878 | 56.9% | 18 | −4 | 12 | 12 | $7,100 |
| Suwannee | 12,518 | 54.1% | 11 | −3 | 8 | 6 | $7,718 |
| Jackson | 12,232 | 52.3% | 13 | −4 | 7 | 7 | $7,396 |
| Gadsden | 11,272 | 71.5% | 17 | −4 | 7 | 10 | $7,068 |
| Okeechobee | 9,751 | 60.1% | 25 | +4 | 22 | 20 | $6,654 |
| Wakulla | 8,151 | 65.4% | 17 | −4 | 7 | 10 | $7,068 |
| DeSoto | 7,821 | 57.8% | 26 | −4 | 22 | 21 | $6,446 |
| Hendry | 7,639 | 61.5% | 22 | no change | 16 | 17 | $6,716 |
| Bradford | 6,312 | 50.7% | 15 | −2 | 14 | 10 | $7,037 |
| Washington | 6,089 | 49.6% | 13 | −4 | 7 | 7 | $7,396 |
| Baker | 5,761 | 45.6% | 18 | −7 | 19 | 12 | $6,878 |
| Taylor | 5,309 | 55.5% | 17 | −4 | 7 | 9 | $7,156 |
| Madison | 5,087 | 56.4% | 17 | −4 | 7 | 9 | $7,156 |
| Holmes | 4,877 | 53.4% | 13 | −4 | 7 | 7 | $7,396 |
| Gilchrist | 4,843 | 52.0% | 13 | −2 | 8 | 7 | $7,569 |
| Dixie | 4,749 | 62.1% | 13 | −2 | 8 | 7 | $7,569 |
| Hardee | 4,701 | 61.8% | 23 | −2 | 24 | 18 | $6,061 |
| Gulf | 4,684 | 47.0% | 13 | −4 | 7 | 7 | $7,396 |
| Jefferson | 4,250 | 63.7% | 17 | −4 | 7 | 10 | $7,068 |
| Franklin | 3,612 | 53.4% | 17 | −3 | 7 | 11 | $7,068 |
| Hamilton | 3,464 | 58.7% | 12 | −3 | 8 | 6 | $7,638 |
| Calhoun | 3,129 | 62.4% | 17 | −4 | 7 | 10 | $7,068 |
| Union | 2,555 | 51.5% | 12 | −2 | 8 | 7 | $7,638 |
| Glades | 2,529 | 58.1% | 27 | +6 | 16 | 22 | $6,428 |
| Liberty | 1,595 | 69.8% | 17 | −4 | 7 | 10 | $7,068 |
| Lafayette | 1,526 | 46.0% | 12 | −3 | 8 | 6 | $7,638 |
Enrollment is the CMS Medicare Monthly Enrollment figure for June 2026; plan counts are from the CMS 2027 landscape file. A county with no enrollment figure was suppressed by CMS for privacy.
Plan ratings across Florida
CMS rates each Medicare contract from 1 to 5 stars on clinical quality, member experience and customer service. Ratings apply to the contract, so every plan under one contract carries the same overall rating. This distribution covers Florida Medicare Advantage plans and excludes Special Needs Plans.
| Overall rating | Plans | Share |
|---|---|---|
| 5★ | 47 | 14.6% |
| 4.5★ | 161 | 50.0% |
| 4★ | 65 | 20.2% |
| 3.5★ | 49 | 15.2% |
The Florida average is 4.32 stars across 322 rated plans, and 84.8% are at 4 stars or better. 3 plans have no rating because their contract is too new to have one. Individual counties vary a long way from this: a county with fewer carriers can sit well below the state figure even though the same plans are rated the same way.
Stand-alone Part D in Florida
Florida is one CMS Part D region, so the same stand-alone drug plans are sold in all 67 counties. 1,556,523 Floridians hold one alongside Original Medicare, and this is where the sharpest 2027 increases landed.
| Measure | 2026 | 2027 |
|---|---|---|
| Stand-alone Part D plans | 10 | 11 |
| With a $0 monthly premium | 0 | 0 |
| Average monthly premium | — | — |
| Average annual deductible | $503.60 | $630.64 |
If you are on Original Medicare with a stand-alone drug plan, this table is the part of the page that applies to you. The premium and the deductible both moved, and the plan you are in may no longer be the cheapest way to cover the same drug list. That is worth checking every year, and particularly this one.
Where JCKC Financial Services actually works
We are licensed in Florida and we work in three counties — Broward, Miami-Dade, Palm Beach. They are the three largest Medicare counties in the state, and between them they hold more beneficiaries than the next six combined. Each has its own page with every plan, premium and rating.
How and when to enroll
Four windows cover almost every situation. Enrolling at the wrong time is the most common avoidable mistake in Medicare, and some of it cannot be undone until the following year.
| Window | Dates | Who it is for |
|---|---|---|
| Annual Enrollment Period | October 15 – December 7, 2026 | Anyone on Medicare. Change Medicare Advantage or Part D plans for coverage starting January 1, 2027. The last choice you make by December 7 is the one that takes effect. |
| Medicare Advantage Open Enrollment | January 1 – March 31, 2027 | People already in a Medicare Advantage plan. One switch to another Medicare Advantage plan, or back to Original Medicare with a stand-alone Part D plan. |
| Non-renewal Special Enrollment Period | December 8, 2026 – end of February 2027 | Members whose plan is not being renewed for 2027. Extra time beyond the Annual Enrollment Period. |
| Initial Enrollment Period | The 7 months around your 65th birthday | People new to Medicare. Late Part B and Part D enrollment carries a penalty that lasts as long as you have the coverage. |
Free review, no obligation
Want someone local to go through your county’s shelf with you?
Questions about Medicare in Florida
How many Medicare Advantage plans are available in Florida for 2027?
Florida has 308 Medicare Advantage plans for 2027, down from 325 in 2026, plus 252 Special Needs Plans and 11 stand-alone Part D plans. How many of those you can actually choose depends on your county: the county table on this page gives the number for each one.
Which Florida county has the most Medicare plans?
Plan availability tracks population closely. Miami-Dade County has the most beneficiaries at 524,508, and the large South Florida counties carry the deepest shelves. A rural county may have a third as many plans. The county table ranks all 67 counties by enrollment and shows the plan count beside each.
Is Humana leaving Florida in 2027?
No, but it is pulling back. Humana goes from 121 plans in Florida for 2026 to 122 for 2027, with 10 plans off the shelf and 11 new ones. The cuts are concentrated in its Giveback PPOs. If you are in a Humana plan, the Annual Notice of Change it sent you by September 30 tells you whether yours is one of them.
Do the star ratings on this page apply to 2027?
No, and they are labeled accordingly. CMS releases new ratings in October and the 2027 landscape file ships with the rating column empty, so every star figure here is the contract’s 2026 overall rating. On that basis 84.8% of Florida Medicare Advantage plans are at 4 stars or better, averaging 4.32 stars.
Does JCKC Financial Services cover my county?
We work in Broward, Miami-Dade, Palm Beach — the three largest Medicare counties in Florida. If you are in one of those, your county page has every plan, premium and rating. If you are not, the county table on this page still gives you the plan counts and enrollment for where you live, and you are welcome to call, but we will tell you honestly if you are better served by someone closer.
Sources and methodology
-
CY2027 Medicare Advantage / Part D Landscape Source Files, Centers for Medicare & Medicaid Services —
cy2027-landscape-202609.zip (CY2027_Landscape_202609.csv). Published 2026-09-28. Accessed 2026-10-12. -
CY2026 Medicare Advantage / Part D Landscape Source Files, Centers for Medicare & Medicaid Services —
cy2026-landscape-202603.zip (CY2026_Landscape_202603.csv). Published 2026-03. Accessed 2026-10-12. The March 2026 refresh of the CY2026 landscape, which is the CY2026 vintage loaded in the data. CMS republishes the landscape during the plan year; the September 2025 release that first set CY2026 is superseded by this one. -
2026 Part C & D Medicare Star Ratings Data, Centers for Medicare & Medicaid Services —
star_ratings_2026.zip. Published 2025-10-09. Accessed 2026-10-12. The newest star ratings CMS has published. CY2027 ratings are blank in the landscape file until the October 2026 release, so every star figure on this page is the 2026 rating of the contract that carries the plan into 2027. -
Medicare Monthly Enrollment (June 2026), Centers for Medicare & Medicaid Services —
Medicare Monthly Enrollment Data_June 2026.csv. Published 2026-09-23. Accessed 2026-10-12. -
Medicare & You 2027, Centers for Medicare & Medicaid Services —
CMS Product No. 10050. Accessed 2026-10-12.
How these numbers were produced
- Plan counts, premiums, deductibles and out-of-pocket maximums are counted directly from the CMS landscape source files for Florida, for both plan years. Nothing is modeled or estimated.
- A plan is identified by its contract, plan and segment together. Statewide figures count each plan-segment once; county figures count it in every county where it is sold. Premium, out-of-pocket maximum, deductible and star rating were checked to be identical for a given plan-segment across every county it appears in, which is what makes the statewide collapse safe.
- Every Medicare Advantage figure excludes Special Needs Plans and stand-alone Part D plans, which are counted on their own rows. Mixing them moves the premium and out-of-pocket averages a long way.
- Average Part C premium, average consolidated Part C + D premium and average monthly premium charged are three separate rows and are never combined. The consolidated average covers MA-PD plans only, because a medical-only plan has no Part D component.
- Star ratings are the contract’s 2026 overall rating, the newest CMS has published. Plans whose contract has no rating are shown as unrated rather than dropped from the count.
- Enrollment is from the CMS Medicare Monthly Enrollment file for June 2026, at state and county level. CMS does not publish plan-level enrollment by county in these files, so this page carries no "most popular plan" ranking.
- Plans are described as leaving or arriving purely on whether a matching contract-plan-segment exists in each year’s file. Because the CMS 2027 plan crosswalk has not published, no plan is labeled terminated and no successor is named.
- This page is a reading of public CMS data, not plan advice. Benefits, networks and formularies are set by the carriers and change; the plan’s own Evidence of Coverage governs.